TeamSpeak is an online voice solution primarily used by gamers. It has a variety of useful features that set it apart from other voice solutions like Discord, such as cross channel communication, priority speakers, and most relevant to this article, built-in audio recording.
When using the built-in audio recording feature, TeamSpeak notifies all users in the channel audibly by announcing “A user has started recording in your channel”. All users in the server are also visually notified by a [Recording] tag next to the recording user’s name.
But how tightly is that notification wired into the recording feature? Could it be removed without breaking recording itself?
More tightly than expected. The client registers a packet handler, sends a command, and waits for server acknowledgment before recording begins locally. Removing the network call breaks recording entirely.
In the end I was able to remove this network dependency and perform local recordings without notifying the server.
Disclaimer and Scope:
This research was conducted entirely on my own machine, patching my own copy of the TeamSpeak 3 client, and tested against a private server I control using a second client I also control. No modified binaries are distributed here.
It’s worth being direct about what this notification is and why it exists. The “A user has started recording” announcement and the [Recording] tag are a consent mechanism. They tell everyone in a channel that they’re being recorded, which people reasonably expect and which recording laws in many jurisdictions require. Defeating that mechanism to record real people without their knowledge would be unethical, and depending on where you are, illegal. That is not the point of this post and not something I did.
What this post is actually about is the reverse-engineering methodology: using the recording notification as a concrete, verifiable target to trace a signal from a UI action, through a Qt dispatch layer, to an outbound network call, and to understand why the client behaves the way it does. The notification made a good target precisely because it’s easy to verify. I can watch for the packet in Wireshark and watch for the tag on a second client. Because the work is confined to a client I own on a server I own, it’s a client-side modification rather than an attack on TeamSpeak’s infrastructure or other users, and I treated that boundary as the line I wouldn’t cross. I didn’t pursue formal disclosure to TeamSpeak, since this isn’t a server-side vulnerability but local self-patching, and that distinction is exactly why the ethics here are about consent rather than about breaking into anything.
Table of contents
Open Table of contents
The Target
There are multiple versions of the TeamSpeak client available, at the time of writing this the two clients available for download are TeamSpeak 6 and TeamSpeak 3. This project focuses on TeamSpeak 3, only because it’s my preference and I personally use it. While the client is available on Windows, macOS, and Linux, this project focuses exclusively on the Windows version. TeamSpeak 3 is a Qt-based application that utilizes their proprietary network protocol. The specific version of TeamSpeak 3 I am working with for this project is 3.6.2 which uses Qt version 5.15.2. Qt’s signal and slot mechanism connects UI actions to their underlying functions through a dispatch layer rather than direct calls. Understanding this mechanism is necessary for tracing execution from a UI action to its handler. The client also ships with no debug symbols and no source is publicly available, so all type information and function names visible in this post were reconstructed from the binary. Static analysis was performed in Binary Ninja with WinDbg used for dynamic analysis and Time Travel Debugging traces. Wireshark was used to verify network behavior at key points in the research.
Static Analysis
After loading the binary into Binary Ninja, string search is the natural starting point when working with a binary with no symbols. I searched for the string “Start Recording”, which is the text on the button that starts recording.
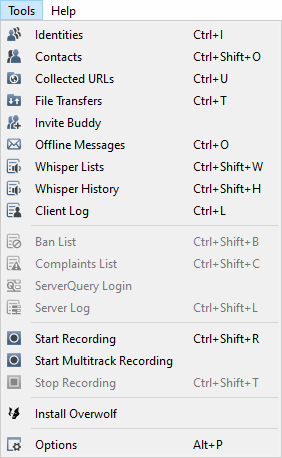
That string appears twice in the binary. The first reference leads to what appears to be a UI string initialization method, but the second is more interesting. The second reference is in a method setting up the QActions for the toolbar buttons, where each action is being initialized along with its signal/slot connections.
Most significantly, this is where Qt wires the signal to its slot, and the slot method address is visible directly in the binary.
Qt connects the signal and slot with the method QObject::connectImpl() which can be seen here:
QAction* rbx_154 = *(arg1 + 0x248)
int32_t var_e8_82 = 0xffffffff
QMetaObject::tr(this: &data_7ff74f5d0ab8, &arg_10, "Start recording", 0)
QAction::setStatusTip(this: rbx_154, &arg_10)
QString::~QString(this: &arg_10)
QAction* rbx_155 = *(arg1 + 0x248)
QMetaObject::tr(this: &data_7ff74f5d0ab8, &arg_18, "Ctrl+Shift+R", 0)
QKeySequence::QKeySequence(this: &arg_10, &arg_18, 0)
QAction::setShortcut(this: rbx_155, &arg_10)
QKeySequence::~QKeySequence(this: &arg_10)
QString::~QString(this: &arg_18)
QAction::setVisible(this: *(arg1 + 0x248), data_7ff74f6a9f3b == 0)
void** rbx_156 = *(arg1 + 0x248)
arg_10.q = QAction::triggered
int32_t* rax_197 = sub_7ff74ee7f73c(0x18)
arg_20.q = rax_197

if (rax_197 == 0)
    rax_197 = nullptr
else
    *rax_197 = 1
    *(rax_197 + 8) = sub_7ff74e3482a0
    *(rax_197 + 0x10) = arg1

struct QMetaObject const* const var_c8_15 = QAction::staticMetaObject
QObject::connectImpl(&arg_18, rbx_156, &arg_10, arg1, nullptr, rax_197.d, nullptr, nullptr)
The key line is *(rax_197 + 8) = sub_7ff74e3482a0.
This is where Qt stores the function pointer to the actual handler that executes when the record button is pressed.
After defining a struct in Binary Ninja to represent the slot object and renaming the slot method, the same section reads more clearly.
if (start_recording_slot_object == 0)
    start_recording_slot_object = nullptr
else
    start_recording_slot_object->ref_count = 1
    start_recording_slot_object->slot_method = start_recording_slot
    start_recording_slot_object->receiving_obj = arg1

struct QMetaObject const* const var_c8_15 = QAction::staticMetaObject
QObject::connectImpl(&arg_18, rbx_156, &arg_10, arg1, nullptr, start_recording_slot_object.d, nullptr, nullptr)
The slot method is named start_recording_slot here because Qt uses it for both calling and cleanup depending on the op code passed internally.
When invoked, the actual logic to initiate recording is in another method start_recording_slot() calls which I renamed init_start_recording().
Examining init_start_recording() reveals the launching of a file picker dialog, after which the selected filepath is stored in a QSqlDatabase.
These findings established the recording setup flow but did not reveal how the server is notified.
The next step was to find the network call responsible for that notification.
To do this, I used the symbol search in Binary Ninja to locate common Windows networking API calls.
The two candidates to investigate were the Windows API functions WSASend() and WSASendTo().
I chose to focus on WSASendTo() as it handles UDP traffic, which aligns with TeamSpeak’s known use of UDP for voice communication.
WSASendTo() is only referenced in one method, which is itself only referenced by a single parent method.
That parent method is only referenced as an entry in a Vtable struct that Binary Ninja identified as UDPSocket::UDPClient::VTable.
The VTable struct name combined with the WSASendTo() call chain makes the purpose of this parent method clear.
I renamed it send_udp_packet().
Because the reference is a VTable entry rather than a direct call, the caller is resolved at runtime and cannot be determined through static analysis alone.
At this point I turned to dynamic analysis to observe the actual call chain at runtime.
Dynamic Analysis
Attaching the Debugger
Before dynamic analysis could begin, TeamSpeak’s launch behavior required some investigation.
When launching TeamSpeak with a debugger attached, I encountered an error 0x800702E4 which is ERROR_ELEVATION_REQUIRED.
Launching the debugger as administrator does not resolve this issue, but investigating the program manifest explained why.
Looking into the TeamSpeak 3 manifest, there is the following section:
<trustInfo xmlns="urn:schemas-microsoft-com:asm.v3">
  <security>
    <requestedPrivileges>
      <requestedExecutionLevel level="asInvoker" uiAccess="true"></requestedExecutionLevel>
    </requestedPrivileges>
  </security>
</trustInfo>
This tells Windows that the application needs elevated UI access. This allows TeamSpeak’s global hotkeys to function even when a higher privilege window has focus, bypassing Windows’ User Interface Privilege Isolation. This changes the startup pattern of the executable. Windows reads the manifest at launch, validates that the executable is signed and located in a trusted directory, then restarts the process with the appropriate UI access privileges granted. Because of this restart, the debugger must be attached to the second elevated instance after it has fully launched, which requires the debugger to be elevated as well.
Time Travel Debugging
Once the debugger is attached it becomes apparent that live debugging presents a problem for a program dependent on network calls and staying connected to a server. If a breakpoint is hit and execution isn’t resumed quickly, the server connection times out and disconnects. This becomes easier to manage by recording the debugging session with WinDbg Time Travel Debugging (TTD), where the session is recorded and analyzed after the fact, meaning breakpoints are set against the recording rather than interrupting live execution. The workflow necessary to get a successful TTD session flows like this:
- Start TeamSpeak 3
- Attach elevated debugger with TTD recording enabled
- Perform action you wish to debug
- End debug session
In this case, the action I am debugging is the recording action, so the flow of actions I recorded is:
- Connect to Server
- Begin Recording session
- End Recording session
- Disconnect from server
Once the recording completed, I opened it in Binary Ninja using the WinDbg TTD debug engine and set a breakpoint at send_udp_packet().
My intention was to find the network call that happens as a result of the start recording action.
This posed a problem though.
The sheer number of audio packets being sent while connected to a server meant an enormous number of network calls to sort through.
Narrowing down the relevant packets required a different approach.
Wireshark provided a way to narrow down which packets were relevant before diving into the debugger data.
Network Traffic Analysis
Before trying to interpret data at the breakpoints for each packet, I opened Wireshark and recorded the same set of steps used in the TTD recording. I set the following filter in Wireshark to narrow down the traffic to UDP packets that were outgoing to the TeamSpeak server I was connecting to:
ip.dst==server_ip && ip.src==my_ip && udpThe advantage of Wireshark over the debugger is that I can see the packets as they happen live, including the moment I press the start and stop recording buttons. Pausing the capture shortly after makes it straightforward to identify the approximate time window where the recording packets should appear. Being silent during the TeamSpeak session also helps because repeated empty audio packets look similar to each other, making any other kind of packet stand out by comparison. In between connecting and pressing the start recording button, the two packet sizes appearing most frequently are 55 and 57 bytes. Excluding these from the filter left only the packets of interest.
ip.dst==server_ip && ip.src==my_ip && udp && frame.len != 57 && frame.len != 55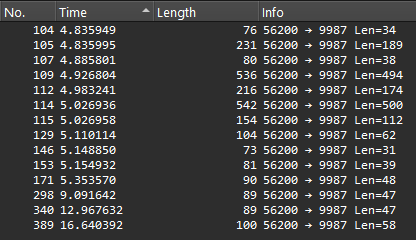
With this filter applied, only one new packet appears when recording starts.
The frame length is 89 bytes, but the more relevant figure is the 47 byte payload.
The 89 byte total includes headers added by lower network layers that are not part of what gets passed to WSASendTo().
With 47 identified as the target payload size, I needed to locate where that value appeared in the method arguments at the breakpoint.
To do this, I temporarily removed the frame length exclusions to capture all packets again.
For each of the first three packets, I inspected the send_udp_packet() arguments at the breakpoint, examining the values in rcx, rdx, r8, and r9.
The payload size was found in the second argument.
I also followed the other pointer values in the struct to inspect surrounding members, but nothing stood out as immediately meaningful.
Dumping rdx with dq rdx across the three packets showed the payload size consistently at offset 0x10.
Time Travel Position: 3C3D8:1ED6
>>> dq rdx
00000189`629a7ef0  00007ff6`621989f8 00000189`6541fa30
00000189`629a7f00  00000000`00000022 002d0032`00000000

Time Travel Position: 3C3F6:AB8
>>> dq rdx
00000189`6529b350  00007ff6`62196fc0 00000189`6542f030
00000189`6529b360  00000000`000000bd 00000189`00000002

Time Travel Position: 3C9F3:27
>>> dq rdx
00000189`629a7ef0  00007ff6`621989f8 00000189`6541b140
00000189`629a7f00  00000000`00000026 002d0032`00000000
The values at offset 0x10 across the three packets were 0x22 (34), 0xBD (189), and 0x26 (38) respectively, matching the payload sizes of the first three packets observed in Wireshark.
Now that the payload size location was confirmed, I updated the breakpoint to only break when it matched the recording packet’s expected value of 0x2f (47).
bp 0x7ff661559e70 ".if (qwo(rdx+0x10) == 0x2f) {} .else {gc}"This reads the qword at offset 0x10 from rdx, the second parameter, and continues execution unless it equals the recording packet’s payload size, 0x2f (47).
Identifying the Call Chain
With the conditional breakpoint now targeting only the recording packet, I could use TTD to step backwards through the call stack from send_udp_packet().
This revealed the VTable dispatch call that was unresolvable statically.
With the object type now known at runtime, I updated the UDPSocket::UDPClient::VTable struct definition in Binary Ninja to include send_udp_packet() at the correct slot with its resolved signature.
Next, I renamed the object calling send_udp_packet() to udp_client, retyped it to UDPSocket::UDPClient::VTable**, and added a code cross reference between the call and implementation.
The following shows the VTable call site before and after renaming and retyping:
//Before
int64_t* rcx_35 = *(r14 + 0x48)
(*(*rcx_35 + 8))(rcx_35, rax_2, arg2 + 0x478, arg2 + 0x488, var_1f8, var_1f0, mtx_2, var_1e0_1, mtx)

//After
struct UDPSocket::UDPClient::VTable** udp_client= *(r14 + 0x48)
(*udp_client)->send_udp_packet(udp_client, rax_2, arg2 + 0x478, arg2 + 0x488)
The struct definition before and after the update:
//Before
struct __base(`UDPSocket::VTable`, 0) __data_var_refs `UDPSocket::UDPClient::VTable`
{
    __inherited void*** (* const `Transmission::VTable::vFunc_0`)(void*** arg1, char arg2);
    __inherited void (* const `Transmission::VTable::_purecall`)() __noreturn;
    __inherited void (* const `Transmission::VTable::_purecall`)() __noreturn;
    __inherited void (* const `UDPSocket::VTable::_purecall`)() __noreturn;
};

//After
struct __base(`UDPSocket::VTable`, 0) __data_var_refs `UDPSocket::UDPClient::VTable`
{
    __inherited void*** (* const `Transmission::VTable::vFunc_0`)(void*** arg1, char arg2);
    int64_t (* const send_udp_packet)(void* arg1, int64_t* arg2, int64_t* arg3, int16_t* arg4);
    __inherited void (* const `Transmission::VTable::_purecall`)() __noreturn;
    __inherited void (* const `UDPSocket::VTable::_purecall`)() __noreturn;
};
The method calling send_udp_packet() loads an assertion failure string that reveals its expected precondition.
lea rdx, [rel data_7ff662197ff0] {"Assertion "packetType == COMMAND_LOW" failed at C:\...\packethandler_b"}The assertion packetType == COMMAND_LOW, combined with the packet handler file path in the failure string made the method’s purpose clear.
I renamed it command_low_handler().
command_low_handler() is called twice in the TTD trace, but only the call preceding the recording packet is relevant here. Continuing to step backwards from the relevant call revealed more of the chain.
Within command_low_handler(), just before the assertion check, a method is called that reads a value at an offset of its single parameter and returns it.
That return value is then checked in the conditional that determines whether the assertion failure routine fires.
Based on this role I renamed it get_packet_type().
Next I started stepping over backwards from send_udp_packet() and observed the register rax containing the payload size.
This register contained the return value from the previous method, and upon inspection that method was a getter method, so I named it get_payload_size().
This getter appeared in the call chain just above command_low_handler(), which led to inspecting the parameters at that level more closely.
Discovering the Command String
After inspecting the parameters of command_low_handler() and its calling method, I found something unexpected in the fourth parameter of the method calling command_low_handler().
The struct at that parameter contained the recording payload size at the same offset as before, but the member at offset 0x8 pointed to a plain text string.
>>> dq r9
00000189`65e871c0  00007ff6`62196fc0 00000189`65b88950
00000189`65e871d0  00000189`0000002f 00000189`00000000
00000189`65e871e0  00000000`00000000 00000000`00000000
00000189`65e871f0  00000000`00000000 00000000`00000000

>>> db poi(r9+8)
00000189`65b88950  00 00 00 00 08 00 00 00-00 00 00 31 22 63 6c 69  ...........1"cli
00000189`65b88960  65 6e 74 75 70 64 61 74-65 20 63 6c 69 65 6e 74  entupdate client
00000189`65b88970  5f 69 73 5f 72 65 63 6f-72 64 69 6e 67 3d 31 00  _is_recording=1.
00000189`65b88980  00 00 00 00 00 00 00 00-c8 66 41 f2 00 a7 00 90  .........fA.....
00000189`65b88990  46 00 6f 00 72 00 6d 00-61 00 74 00 46 00 6f 00  F.o.r.m.a.t.F.o.
00000189`65b889a0  72 00 44 00 69 00 73 00-70 00 6c 00 61 00 79 00  r.D.i.s.p.l.a.y.
00000189`65b889b0  20 00 48 00 65 00 6c 00-70 00 65 00 72 00 00 00   .H.e.l.p.e.r...
00000189`65b889c0  00 00 00 00 00 00 00 00-cc 66 4d f2 00 a8 00 94  .........fM.....
The string clientupdate client_is_recording=1 confirmed this was the recording command and revealed that TeamSpeak’s protocol uses human-readable command strings at this stage of the call chain.
Dumping the equivalent struct in send_udp_packet()’s second parameter showed the same addresses but with the string replaced.
The transformation between these two points is likely the protocol’s packet encryption, which I did not pursue here.
>>> dq rdx
00000189`65e871c0  00007ff6`62196fc0 00000189`65b88950
00000189`65e871d0  00000000`0000002f 00000189`00000002
00000189`65e871e0  00000000`00000000 00000000`00000000
00000189`65e871f0  00000000`00000000 00000000`00000000

>>> db poi(rdx+8)
00000189`65b88950  46 96 4e ff 5d a4 b6 84-00 08 00 31 22 b9 af 4b  F.N.]......1"..K
00000189`65b88960  c0 0a ca e4 e3 3a da 5f-43 4d 38 a6 1e 1f f4 d6  .....:._CM8.....
00000189`65b88970  56 23 85 5a 34 2d 13 a3-10 23 1e 6f d0 7a a0 00  V#.Z4-...#.o.z..
00000189`65b88980  00 00 00 00 00 00 00 00-c8 66 41 f2 00 a7 00 90  .........fA.....
00000189`65b88990  46 00 6f 00 72 00 6d 00-61 00 74 00 46 00 6f 00  F.o.r.m.a.t.F.o.
00000189`65b889a0  72 00 44 00 69 00 73 00-70 00 6c 00 61 00 79 00  r.D.i.s.p.l.a.y.
00000189`65b889b0  20 00 48 00 65 00 6c 00-70 00 65 00 72 00 00 00   .H.e.l.p.e.r...
00000189`65b889c0  00 00 00 00 00 00 00 00-cc 66 4d f2 00 a8 00 94  .........fM.....
The matching addresses across both dumps confirmed these are the same struct, observed before and after the payload transformation that occurs between these two points in the call chain. That transformation is almost certainly TeamSpeak’s protocol-level packet encryption. I didn’t reverse the encoding itself, since it wasn’t necessary to trace the call chain, but it’s the obvious next thread to pull.
Mapping the Call Chain
Continuing backwards past the point where the payload transformation occurs, I traced the remaining call chain from command_low_handler() back to init_start_recording(), naming the methods based on their position and relationship to what was already identified.
The naming reflects position in the chain rather than confirmed behavior.
Higher numbers indicate outer calls, with lower numbers closer to command_low_handler():
register_recording()notify_network_start_recording()command_low_handler_vtable_dispatch_caller()command_low_handler_vtable_dispatch()command_low_handler_caller_3()command_low_handler_caller_2()command_low_handler_caller_1()
The full call chain from the start recording action to the outbound network call, in execution order, is as follows:
start_recording_slotinit_start_recording()register_recording()notify_network_start_recording()command_low_handler_vtable_dispatch_caller()command_low_handler_vtable_dispatch()command_low_handler_caller_3()command_low_handler_caller_2()command_low_handler_caller_1()command_low_handler()send_udp_packet()
With the call chain mapped, the first step was to attempt patching the network call and observe the result.
Early Patch Attempts
First Attempt: NOPing the Call
With the full call chain mapped, the first instinct was to patch as high in the chain as possible.
NOPing out the call to register_recording() removed the network call entirely.
Wireshark confirmed no recording packet reached the server.
The file picker dialog still appeared, but recording never started.
Trying the same approach at notify_network_start_recording() and command_low_handler_vtable_dispatch_caller() produced the same result.
The result was the same at each level: the network call was suppressed but recording never started.
It was not yet clear why.
The next step was to investigate with a more targeted patch lower in the chain.
Code Cave Diagnostic
The NOP attempts confirmed that suppressing the network call prevented recording from starting, but not why.
To understand what was actually happening when the packet was blocked, a more targeted patch was needed at a lower level in the call chain.
Rather than NOPing the entire call, the goal was to conditionally block only packets with the recording payload size at send_udp_packet(), while adding instrumentation to observe the client’s behavior when the packet was dropped.
This required injecting custom logic into a code cave, an empty region of executable memory, and jumping there and back before executing send_udp_packet().
To avoid manually searching for empty executable regions, I wrote a Binary Ninja plugin called Find Code Caves that locates them automatically.
The prologue pushes at the start of send_udp_packet() were replaced with a jump to the cave.
The cave then executed the relocated prologue, performed the size check, and either continued execution or jumped past the send:
; prologue pushes relocated to cave
push rbp
push rbx
push rsi
push rdi
push r12
push r14
push r15

; check payload size
pushfq
push rcx
mov ecx, dword [rdx+0x10]
cmp ecx, 0x2F
je skip

noskip:
pop rcx
popfq
jmp 0x7ff79b939e75 ; resume after prologue in send_udp_packet

skip:
pop rcx
popfq

exit_cave:
jmp 0x7ff79b93a168 ; jump to epilogue in send_udp_packet
The patch blocked the packet from reaching the server as intended.
Recording still never started and the client began timing out, waiting for a server response that never arrived, and eventually threw an exception.
This was the first concrete signal that the client was expecting something back from the server before starting local recording.
To quantify how many times the client was attempting to send the packet, I added a counting breakpoint in the cave skip branch and compared it against an unpatched TTD trace using a similar breakpoint in send_udp_packet():
bp 0x7ff79b939e70 ".if (dwo(rdx+0x10) == 0x2f) {r $t0 = $t0+1; .printf \"hit #%d\\n\", $t0; gc} .else {gc}"The patched session hit the breakpoint multiple times before throwing the exception, while the unpatched trace showed only two calls across a full start and stop cycle, one for start and one for stop. The retry behavior was the confirmation. If the client were simply firing a notification and continuing, there would be no reason to retry when the packet did not arrive. The retries meant the client was waiting for a response before proceeding, and the exception on timeout meant that response never came. Recording never starts because the local recording action is not triggered by sending the command. It is triggered by receiving the acknowledgment. The next step was to find the method responsible for the local recording action and invoke it directly, without the network round trip.
Finding the Recording Method
With the early patch attempts confirming that recording is triggered by the server response rather than the button press, the next step was to find the method responsible for starting local recording directly.
Locating start_recording() and stop_recording()
String search for “recording” surfaced two relevant strings: “Started Recording” and “Stopped Recording”.
Both strings are passed to Qt’s tr() for localization before use.
The method containing the tr() call for “Started Recording” also contained an assertion failure string:
Assertion "!Recorder::getInstance()->isRecording(m_scHandlerID)" failed at C:\..."The assertion string also hinted at a getter method called in the branch conditional, which I renamed get_is_recording().
This method handles a range of client state responsibilities including talk power queries and updates, recording status checks, description updates, and TeamSpeak ID renewal.
Based on this range of responsibilities I renamed it manage_user_status().
In manage_user_status(), start_recording() is called just before the tr() call for “Started Recording”.
The string being localized immediately after the call confirmed its purpose.
I renamed it start_recording(). The same approach applied to “Stopped Recording” identified stop_recording() by the same logic.
The Recorder Singleton
Inspecting the parameters of both start_recording() and register_recording() revealed the same getter method being called and its result passed as the first argument to both.
Binary Ninja had typed the return value as Singleton<class Recorder>::Recorder::VTable**, which reflects the standard C++ object layout where a pointer to a struct containing the VTable pointer reads as a double pointer.
I renamed the type to recorder_singleton to make it mappable and renamed the getter get_recorder_singleton().
The singleton has an is_recording member whose offset matches the offset used in get_is_recording(), confirming the relationship between the two.
It also contains a map and set used to manage active recording sessions and track which ones need to be stopped.
The same singleton is used in init_start_recording() to store the file path selected by the file picker.
start_recording() retrieves it via get_recorder_singleton() when it needs the path.
The First Working Patch
With start_recording(), its parameters, and the file path retrieval understood, the approach was clear.
The call to notify_network_start_recording() in register_recording() could be replaced with a direct call to start_recording(), using the get_recorder_singleton() method and hardcoding the second param to match what was observed in the recording, 0x1.
At this point in the call chain, the file path has already been stored on the singleton by init_start_recording(), meaning everything start_recording() needs is available.
Just before the call to notify_network_start_recording() there is an assertion that we are not recording, which I just replaced with the parameter setup for the start_recording() call.
call get_recorder_singleton
mov rcx, rax                  ; first param: recorder singleton
mov rdx, 1                    ; second param: tab id

call start_recording
The stop side uses the same pattern: the call to notify_network_stop_recording is replaced with a direct call to stop_recording(), passing the recorder singleton and the same tab ID.
Note on the second parameter
To start testing the patch I just used the same value for the second parameter as what was observed in the TTD recording. At first I thought this was a recording ID, but after testing the patch a bit more I discovered it is related to the tab ID intended to change recording state, meaning that it won’t work when trying to record in a tab in TeamSpeak other than the first one.
Verification
Wireshark confirmed no outbound recording packet reached the server. Local recording started and functioned correctly for single track recording.
To verify the patch behaved as analyzed, I connected a second unmodified client to the same private server I control. With the patch applied, the second client showed no announcement and no [Recording] tag, and the server registered no recording. In other words, the notification path was fully decoupled from the local recording path, which was the technical claim I set out to test.
Extending to Multitrack Recording
The single track patch worked cleanly, but multitrack recording follows a different code path and required a separate patch.
TeamSpeak’s multitrack functionality uses its own singleton and its own start and stop methods, so identifying the multitrack equivalents of start_recording and stop_recording was the first step.
Locating the Multitrack Methods
The multitrack methods were found in manage_user_status, the same method that contains the calls to start_recording and stop_recording.
Both start_multitrack_recording and stop_multitrack_recording are called there alongside their single track counterparts, making them straightforward to identify once the single track methods were already known.
The multitrack recording singleton was identified by matching an address seen in a TTD trace to the first parameter of start_multitrack_recording and notify_network_start_multi.
A member of the singleton was accessible at r14 at the point of the notify call, meaning the base singleton address could be recovered by subtracting the member’s offset from r14.
The Start Multitrack Patch
Unlike the single track patch, the surrounding code around notify_network_start_multi did not leave enough room for the direct replacement approach used for single track.
Instead, the call to notify_network_start_multi was replaced with a jump to a code cave containing the recording call:
lea rcx, [r14-0x18]                ; recover multitrack singleton from r14
mov rdx, 1                         ; hardcoded second parameter
mov r8b, 0x1                       ; hardcoded third parameter
call start_multitrack_recording
jmp <return address in original>   ; jump back after the replaced call
The second and third parameters were hardcoded to 1 based on the values observed in the TTD trace.
Whether these values represent session identifiers, flags, or something else was not fully investigated at this stage.
In retrospect, param 2 is getting passed the same value as the start_recording method’s second param which is linked to the active connection or tab ID.
This patch worked. I confirmed in Wireshark that the recording notification packet didn’t go out when starting. Stopping recording still worked, but sent out a notification still because it still needed to be patched in the same way.
The Stop Multitrack Patch
The stop patch took longer to get right than expected.
My initial attempt patched at the wrong location, replacing a method that called notify_network_stop_multi rather than replacing the notify_network_stop_recording call within it.
The result was that stop_multitrack_recording was called before certain preconditions had been set up in a global object.
When stop was invoked, it checked for a recording to stop, found none, and continued on without stopping anything.
Because the recording was not actually stopping, I second-guessed my identification of stop_multitrack_recording and began investigating a different method entirely.
That method turned out to be a check for active recording sessions used during single track cleanup, not the multitrack stop method at all.
This sent the investigation off track for a while before returning to the original identification and looking at the patch location again.
Once the actual issue was identified as incorrect patch placement rather than incorrect method identification, the fix was to jump to a cave near the beginning of notify_network_stop_multi, preserve the multitrack singleton by pushing it to the stack, perform most of the original notify logic, then replace the call to notify_network_stop_recording with a call to stop_multitrack_recording:
push rcx                      ; preserve multitrack singleton
sub rsp, 0x28                 ; stack alignment
call register_stop_multitrack ; perform original notify precondition setup
add rsp, 0x28
pop rcx                       ; restore multitrack singleton
add rsp, 0x20
pop rbx
mov rdx, 1                    ; hardcoded second parameter
jmp stop_multitrack_recording ; replace the network call with the stop call
This patch worked. Multitrack recording could be started and stopped through the patched client without any recording notification reaching the server, matching the behavior of the single track patch.
Limitations
The patch works for the observed cases but has limitations worth noting.
Several parameter values are hardcoded to 1 based on values seen in the TTD trace, whose exact meaning was not fully investigated.
If those values represent session identifiers or configuration flags that vary across use cases, the patch may not behave correctly in those scenarios.
The core goal, suppressing the recording notification while preserving local recording, is achieved for standard single track and multitrack recording sessions, which was sufficient for this project.
Reflection
This was my first real reverse engineering project of this scope. Much of the workflow was new to me. My first time using TTD as an analytical tool, my first time writing code caves that had to survive actual execution, my first time doing binary patching in earnest, and my first time combining Wireshark with debugger data to narrow down what mattered in a sea of network traffic.
The parts that felt the hardest turned out to be the parts I learned the most from. The initial NOP patches that suppressed the network call but did nothing useful were frustrating at the time, but they were what led to the diagnostic code cave, which led to the retry evidence, which led to the ACK dependency insight. If the first patch had worked, the whole architecture of the system would have stayed hidden from me. The failed attempts were the actual work.
The stop multitrack patch was the moment I most wanted to give up. When it did not work, my first instinct was to question whether I had identified the right method at all, and I spent time investigating a completely different method before realizing my identification had been correct the whole time. The patch location was wrong, not the analysis. That is a lesson I will not forget: when a patch fails, verify the patch itself before questioning the analysis that led to it.
Coming out of this project, I have a much better sense of how much of reverse engineering is deliberate methodology and how much is pattern recognition built up from doing the work. The tools are only as useful as the questions you know to ask them, and this project gave me a lot of new questions to ask.